Updates coming later in 2026: Thanks for your patience as we updated the College Explorer to ensure you have the latest data from NWEA research: College Explorer Tool: Mapping the Road to College. You can embed this tool on your own website by following the instructions here: Embedding the NWEA College Explorer Tool on your website.
How does the tool work?
The College Explorer Tool uses correlations between MAP Growth scores (RIT), ACT®, and SAT® scores to pinpoint the colleges and universities for which a student’s forthcoming scores would likely be near the median admissions scores. Additionally, the tool provides a quantitative profile of each institution using data from the U.S. Department of Education’s College Scorecard, which includes valuable information on the cost of attendance and the average annual cost to families at different income levels.
How do I use the College Explorer tool?
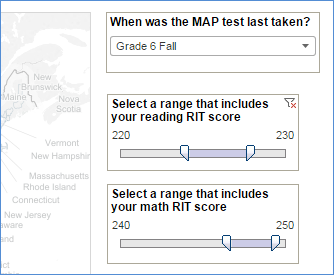
- Under When was MAP Growth taken?, select the grade and term that the student last took the MAP Growth test.
- Use the reading and math sliders to select ranges that include the student's most recent scores.
- The map will dynamically update to show the colleges and universities for which the median ACT and SAT scores of admitted students are within the predicted range of RIT scores that you selected.
- For example, if the student scored 220 on the reading test, select 215-225. By selecting a range instead of a single score, you will be able to see a wider selection of college options that are reasonable options given that score.
- You can adjust the range to see more or fewer colleges.
Can I focus my search on a single state?
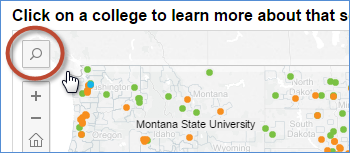
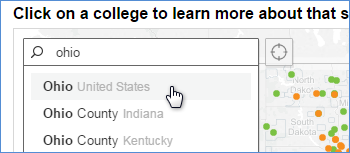
Yes, you can focus your search on a state or even a city. After you select your filters, click on the map and you will see a search bar in the upper left corner. Type and select the city or state you are interested in, and your results will be limited to that region.
Why doesn’t the RIT score range go higher or lower?
The upper and lower ranges reflect the lowest and highest MAP scores associated with hitting the median ACT and SAT scores of admitted students in the colleges and universities included within the tool.
Once you have selected a testing season (for example, “Grade 5 Spring”), the range of selectable reading and math RIT scores will update to reflect the range of RIT scores associated with being “On Track” to achieve an ACT or SAT score that meets or exceeds the median value for admitted college students in the tool. For example, if you select “Grade 5 Fall” in the filter, the selectable range of RIT scores will not include values as low as 150 because there are no colleges identified within the tool for whom the median ACT or SAT score of admitted students corresponds to a 150 RIT.
Important: A RIT score lower than the values shown on the slider does not necessarily mean that a student is not on track for college. It simply means that the median ACT and SAT score of admitted students is higher. Colleges and universities accept students with a range of ACT and SAT scores, and admissions decisions consider many factors in addition to test scores.
Where does this data come from?
The MAP Growth College Readiness benchmarks come from a study conducted by NWEA researchers. This study predicts performance on the ACT and SAT tests in English and mathematics, using MAP scores for students in grades 5 through 10. The study identifies cut scores on MAP Growth that correspond to published college readiness benchmarks on the ACT and SAT and provides a set of tables to help teachers and parents gauge, in a timely manner, whether a student is on track in their preparation for college success.
For more information on the study for the ACT and SAT, refer to:
The information about colleges comes from the College Scorecard, a US Department of Education website designed to increase the transparency of college data, including student completion, debt and repayment, earnings, and more.
Why can’t I search for a particular college I’m looking for?
That functionality is not possible in the version of this tool due to limitations within the Tableau reporting platform.
Why do some colleges seem to be missing?
The tool uses the relationship between MAP Growth scores and predicted ACT and SAT scores to select the range of schools depicted on the map. If a college does not use the ACT or SAT tests for admissions, or the median ACT or SAT score of admitted students is not published in the College Scorecard database, that school will not appear on the map.